WitsView: Relative low point of LCD market confidence (MCI) projected to occur in Mar09~Apr09
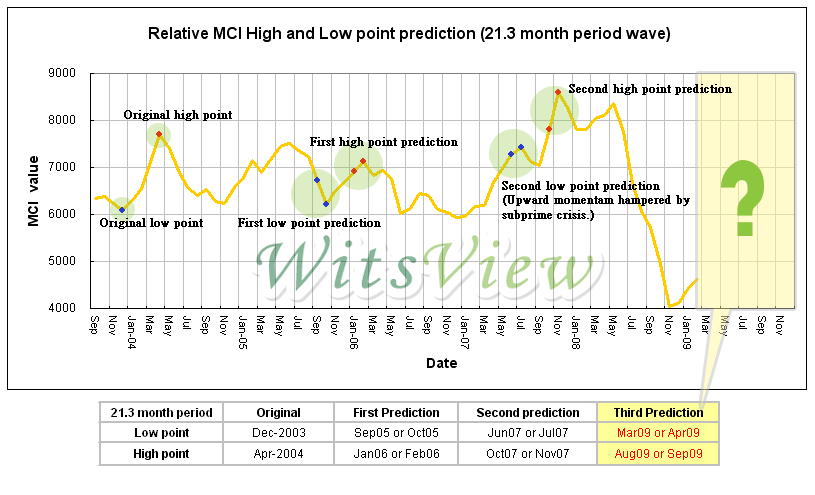
Taipei, March 3, 2009---According to WitsView’s latest research, utilization of the Fourier Transform analysis on the monthly averaged MCI (Market Confidence Index) data reveal that the next relative low point is projected to occur during Mar09~Apr09, while the high point is set to appear in Aug09~Sep09, the traditional peak season.
This outcome shows that March, April or May could be the next relative MCI low point, a signal that the first half of 2009 will likely remain tough for LCD panel makers. Although panel prices have grown more stable now and the monitor ASP has risen slightly, coupled by the recent influx of rush orders, the uncertain end market demand is still a big variable.
When the TFT-LCD market enters into 3Q09, the MCI index is predicted to reach a relative higher point. By then there should be a higher probability in seeing a more evident rebound. But for 4Q09, the MCI will theoretically experience another downward momentum after September. Thus, the TFT-LCD market could once again enter another cyclical downturn, resulting in a relatively slower demand.
WitsView’s study on the monthly averaged MCI data (Sep03~Dec08) show that the two wave components with the two highest amplitudes were the 21.3 month period and 16 month period. The former’s prediction accuracy before 2009 indicate that aside from the second low point prediction (Jun07~Jul07), where the following upward momentum was hampered by the subprime crisis, the other 3 prediction points were quite consistent to the MCI’s projected subsequent movement. Meanwhile, for the 16 month period, there was 1 respective inaccuracy for the 3 high and 3 low prediction points. The inaccuracy was attributed to the relatively lower amplitude. Nevertheless, WitsView believes the 16 month period wave component remains a viable reference.
It is interesting to note that the respective prediction by the 21.3 month and 16 month period of the relative MCI low and high points in 2009 is nearly the same. The former projects the low and high point to be Mar09~Apr09 and Aug09~Sep09. Meanwhile, the latter puts it at Aug09~Sep09 and Apr09~May09. The coincidence further adds to the validity of the 2009 prediction.
All in all, it should be noted that the impact from the current unprecedented financial crisis should not be overlooked. Results from the Fourier analysis on the MCI data should be looked in conjunction with the forthcoming macroeconomic development in better accessing the state of the TFT-LCD industry.
Note: The Fourier Transform is a mathematical tool used in wave analysis, where applications include the studying of heartbeats, sound waves, atmospheric waves and so forth. In essence, it breaks down a time series dataset into different periodic wave components. Each component represents a certain wave frequency. Some have higher amplitudes, while some are lower. The amplitude can be viewed as the “strength” of a particular wave component, where the higher it is, the less likely it is susceptible to external influences.
About MCI
MCI, which stands for Market Confidence Index, is an indicator tailored for TFT-LCD industry. In the past, marketers tend to use the mainstream panel prices to diagnose the health of the TFT-LCD industry and predict its market trend. However, as the application sizes vary and market focus changes all the time, it is never easy to find an appropriate tool to judge the market climate. In view of this, WitsView develops MCI, aimed to become a mutual-language among industry participants for effective communication on industry outlook and market trend.
For detailed information, please check out MCI introduction