


 Facebook
 LinkedIn
 LINE
 Reddit
 WhatsApp
 Kakao

What’s Left to Build
The pipeline continues to expand. Every operator’s remaining build-out grew this month as new capacity entering the tracker outpaces data centers coming online over the past month. TrendForce observes that the data center industry’s forward commitment continues to accelerate.
Figure 1. Remaining 2030 data center pipeline by US hyperscaler, excluding capacity already online.
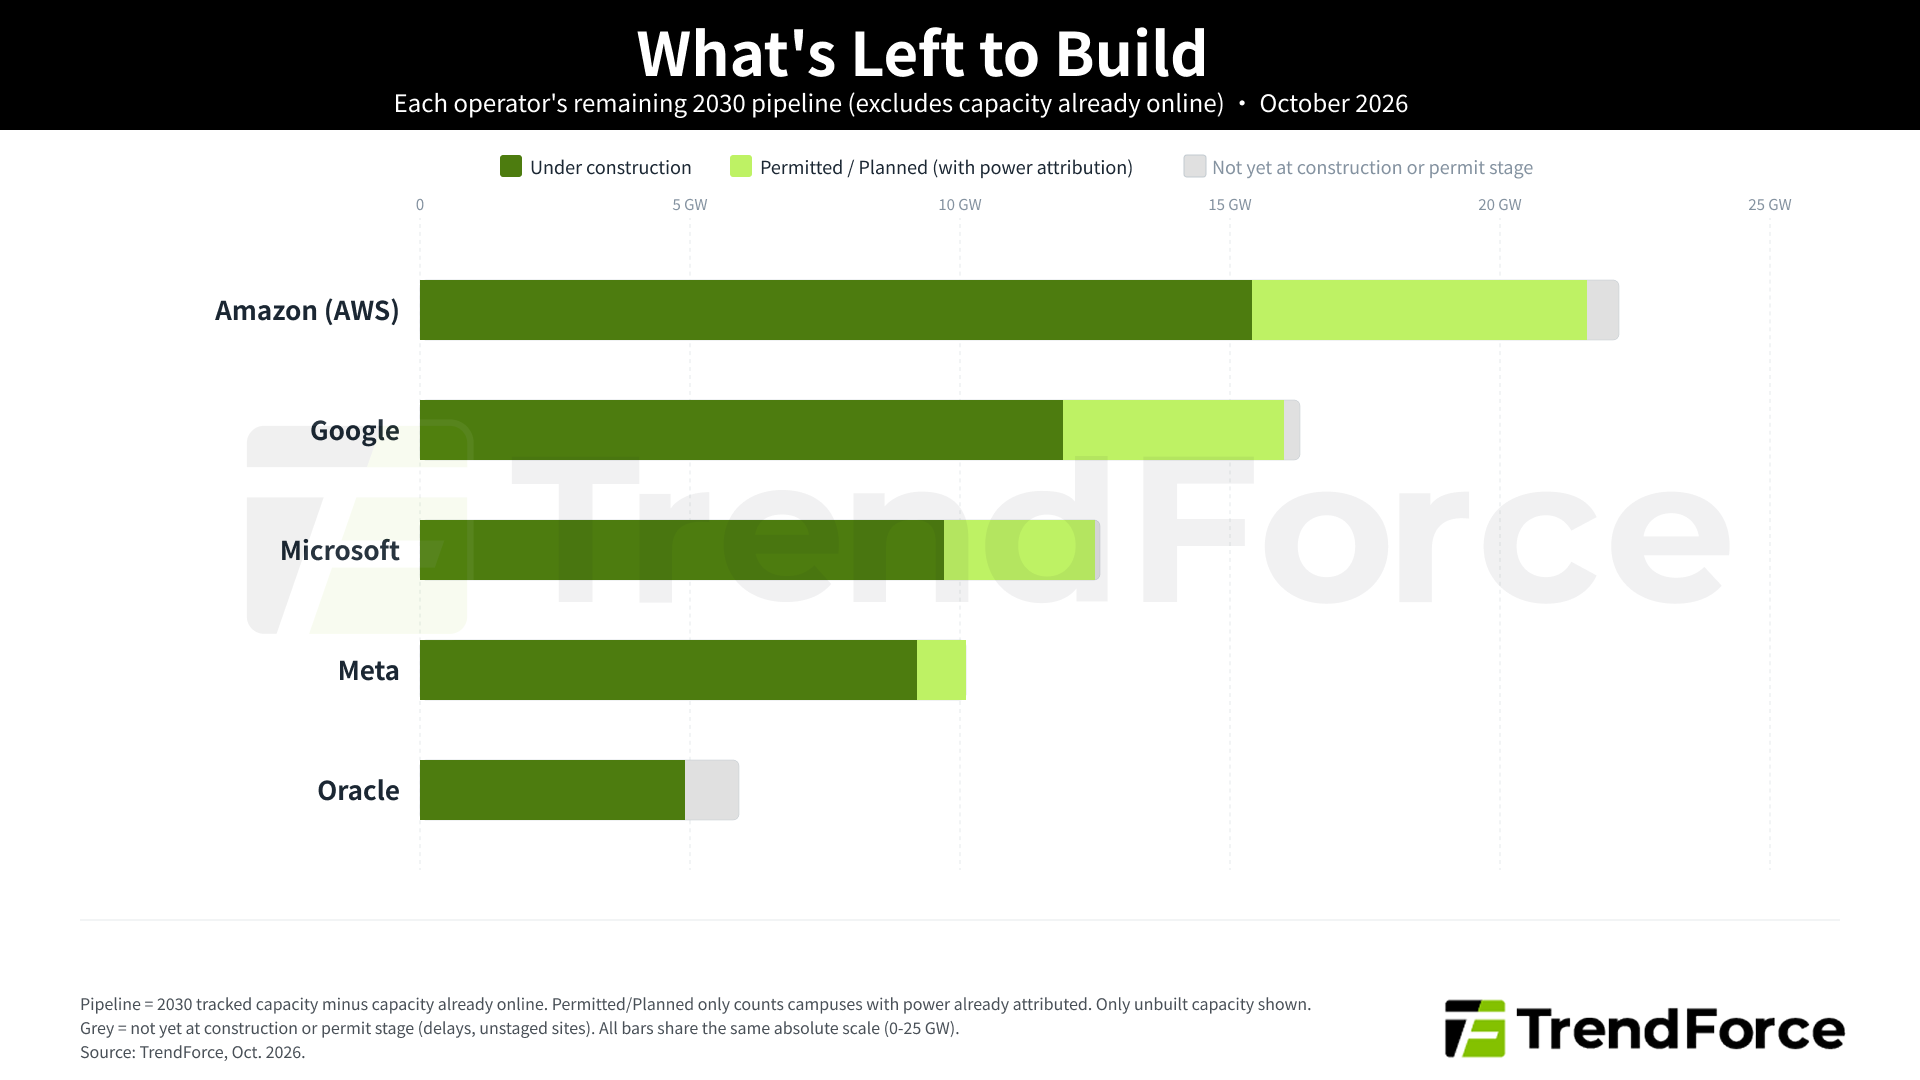
Note: This chart shows how much capacity each hyperscaler still has to bring online, and how confirmed those plans are. Each bar represents an operator’s remaining path to its 2030 pipeline target, excluding capacity already online. Dark green = under construction; light green = permitted or planned capacity with an attributed power figure (sites not yet sized in MW are excluded, so this segment understates the true total); grey = pipeline not yet at either stage, due to possible delay or other complications. The wider the bar, the bigger the build-out ahead.
Monthly Capacity Tracker
The new campuses follow the power
Three-quarters of October’s +4,170 MW (3,111 MW) sits on campuses built next to their own power supply rather than waiting for the grid. Google’s Tembo campus in Wyoming comes with new gas generation from Black Hills Energy, AWS’s Homer City campus is being built around a 4.5 GW gas plant on a former coal station, and AWS’s Greek campus moves onto PPC’s old lignite plant at Agios Dimitrios. We forecast that self-supplied power will determine where and how fast the largest campuses arrive, more than tax breaks or fiber.
AWS diversifies its data center footprint
AWS added 911 MW this month across five new campuses in four countries: Homer City in Pennsylvania, Crossroads in Virginia, Agios Dimitrios in Greece, Glendenning in New South Wales, and Obertshausen in Germany. Nearly half of that capacity (414 MW) sits outside the US, with campuses ranging from a 20 MW first stage in Germany to 336 MW in Pennsylvania. All five are still at the permitting stage, with first capacity forecast for 2029 to 2030.
Figure 2. Monthly Capacity Tracker: campus-level capacity changes backed by in-window evidence.
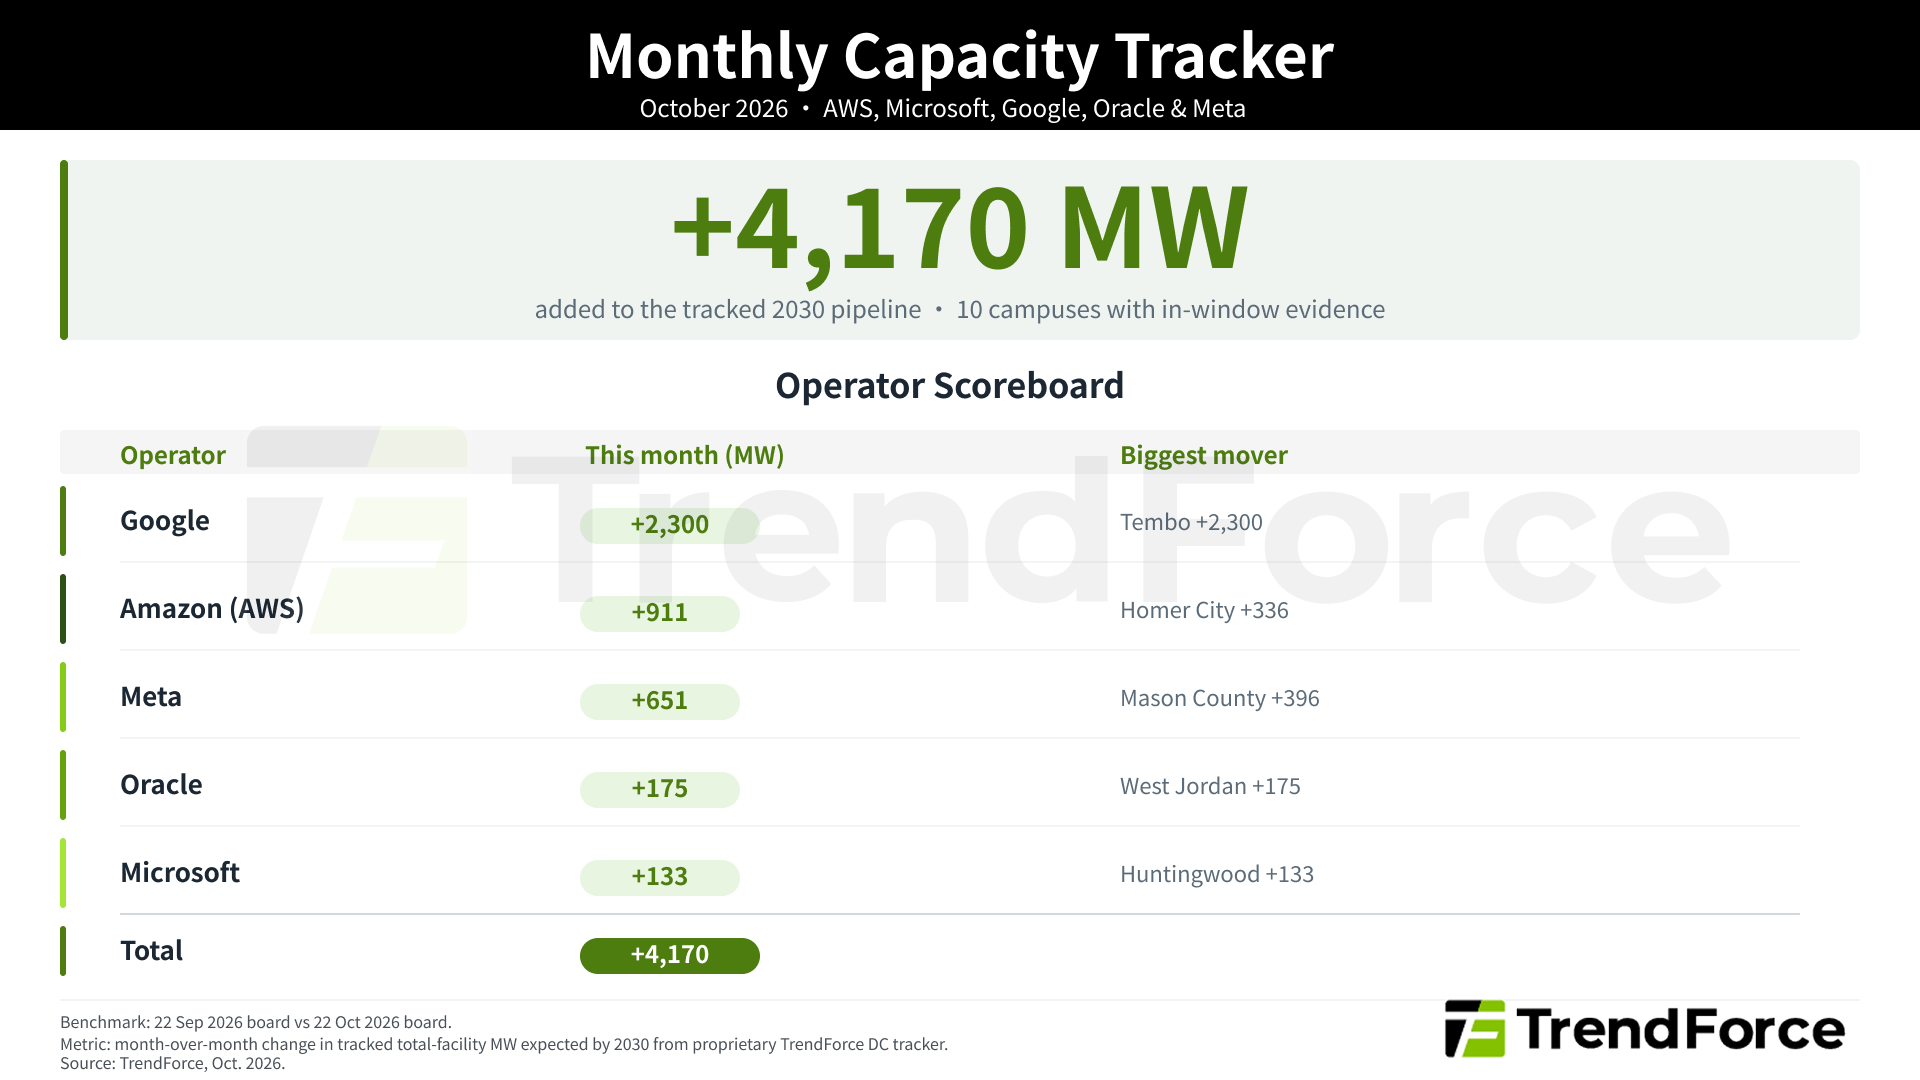
Note: The figures in the monthly capacity tracker are changes to the capacity TrendForce carries in its tracking system, not capacity in operation. Each edition counts only changes whose trigger (a permit action, regulatory filing, construction contract, or operator announcement) is itself dated within the month. Capacity booked on earlier evidence is set aside.
For more information on TrendForce’s Data Center Tracker and market data, please leave a message to contact the Sales Team.
Contact SalesMajor Events
Beyond the charts, here are some major developments we think are worth watching this month. These are the changes across the global build-out that the numbers alone don’t fully capture.
Oracle’s Port Washington buildings are ready before the power is
Vantage’s $15 billion Lighthouse campus for Oracle and OpenAI in Port Washington, Wisconsin, has two of its four data center buildings enclosed. The grid connection is further behind. The 1.3 GW campus depends on more than $2 billion of new ATC transmission lines and five substations, and Wisconsin regulators closed that application on 10 September after ATC filed 564 additional application documents reflecting extensive changes to the project.
Vantage had asked ATC for about 310 MW of service in 2027, with the full 1.3 GW from 2028. Oracle still guides to operation in the second half of 2027.
Why it matters
The constraint at Lighthouse is no longer construction but power approval. TrendForce now forecasts 310 MW of capacity at the campus in 2027, down from 650 MW, while maintaining its full 1.3 GW forecast for 2028.
Figure 3. Vantage’s Lighthouse campus for Oracle and OpenAI, Port Washington, Wisconsin: two enclosed data center buildings (large white roofs) with further halls under construction; 1.3 GW planned across four buildings. Sentinel-2, 6 Oct 2026.
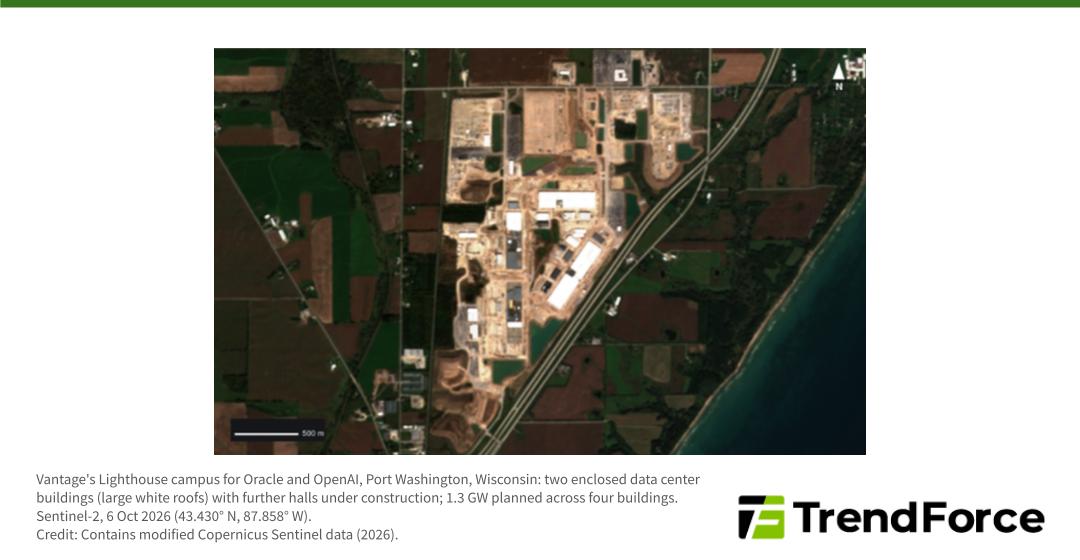
Credit: Contains modified Copernicus Sentinel data (2026).
Meta’s tents show up at its oldest campuses too
Meta’s rapid-deployment “tents” (fabric-roofed halls it can stand up far faster than a conventional data center) made their name at flagship AI sites like Prometheus in Ohio. They are now appearing at legacy campuses as well. At Altoona, Iowa, a campus Meta has run since 2014, a roughly 280-metre tent was already standing next to the newest conventional halls by May 2025, and by August 2026 a second parallel structure appears alongside it.
Why it matters
Tents aren’t a one-off experiment tied to a single flagship build. Meta is using them wherever it already has land, power and fiber, to get compute online as quickly as possible. That turns mature campuses back into growth sites, and means capacity can appear without the usual multi-year construction signal: no new rezoning, no new building shell, just a fabric roof beside the old halls.
Figure 4. Meta Altoona, legacy campus since 2014, with tent structures circled. Sentinel-2 true colour, 28 Aug 2026. Altoona, Iowa.
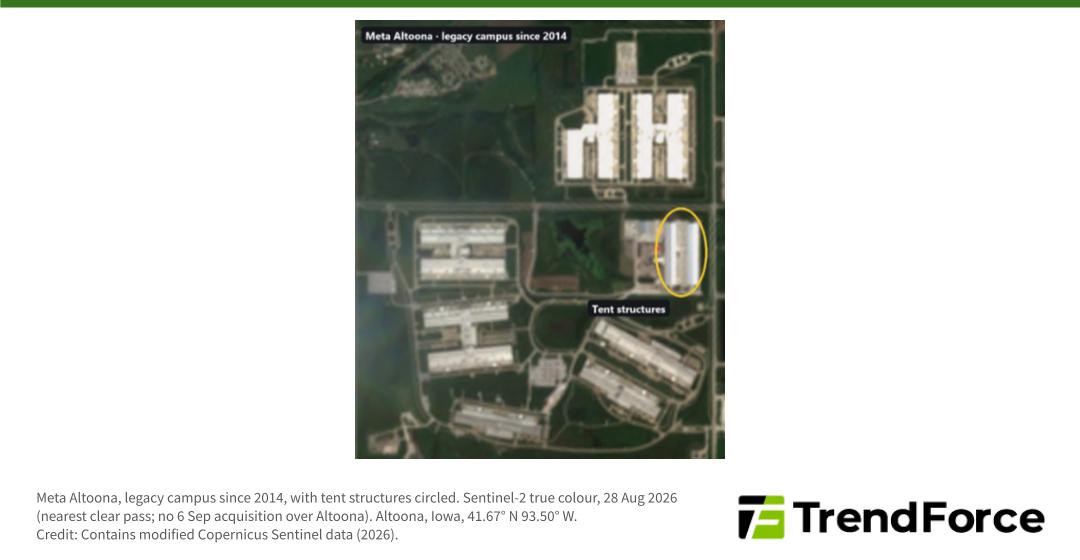
Credit: Contains modified Copernicus Sentinel data (2026).
ByteDance expends its data center capacity into LatAm with campus in Brazil
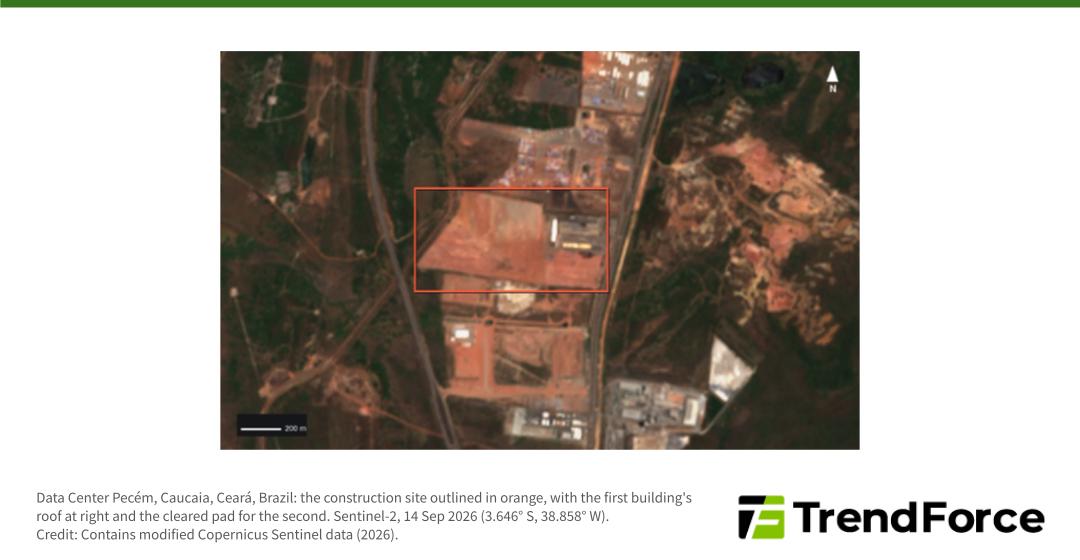
ByteDance’s overseas data center footprint has so far been mostly leased space in Virginia, Ireland, Norway, Finland and Malaysia. Its next big step is in Brazil. At the Pecém port complex in Ceará, Omnia is building the campus for ByteDance, with 200 MW of IT capacity fully contracted in the first phase across 20 data halls in two buildings. That first phase is expected to draw roughly 300 MW of power.
The first building’s structure is finished and moving to electrical and mechanical installation, and the second is starting. Omnia targets operation in July 2027. Power comes from a 20-year, roughly US$2 billion wind supply deal with Casa dos Ventos. The campus is built to serve ByteDance’s global operations, not just Brazil.
Why it matters
Pecém becomes one of the largest ByteDance sites we track outside China and gives it a first foothold in South America. TrendForce forecasts 150 MW there in 2027, rising to 300 MW in 2029.
Figure 5. Data Center Pecém, Caucaia, Ceará, Brazil: the construction site outlined in orange, with the first building’s roof at right and the cleared pad for the second. Sentinel-2, 14 Sep 2026.
Credit: Contains modified Copernicus Sentinel data (2026).
ByteDance’s Taihang expansion moves into interior fit-out
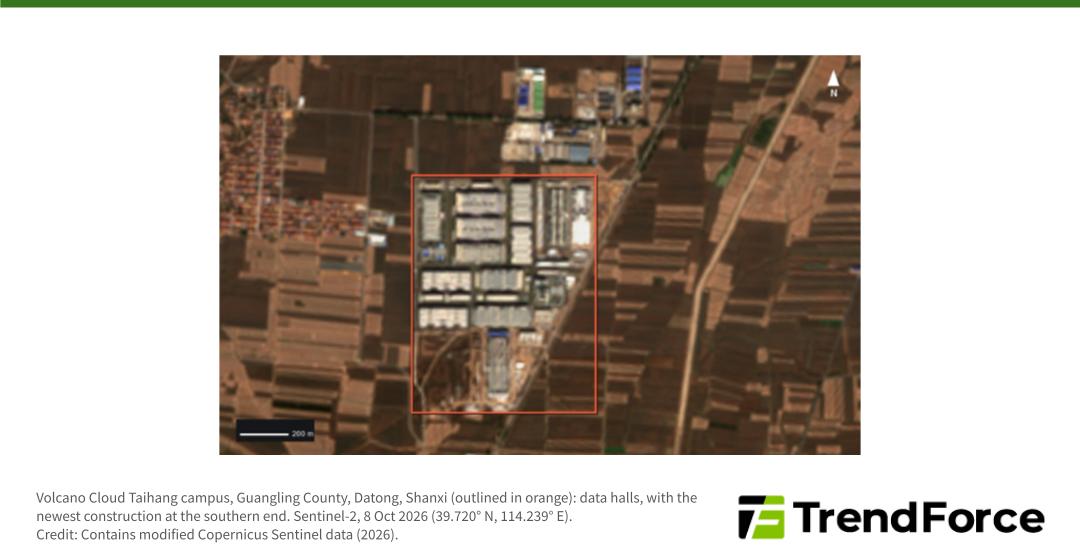
ByteDance’s Volcano Cloud Taihang campus in Guangling County, Datong, in northern Shanxi, is the largest of the self-built campuses we track for the company in China. It is owned outright through a ByteDance subsidiary, not leased from a colocation provider.
The site has grown in three steps since construction began in 2023: four halls first, then six more, and now a four-hall expansion worth RMB 5.2 billion with its own 220 kV substation. In September that expansion awarded its interior fit-out contract. Across all three phases, ByteDance is putting about RMB 12.5 billion into 14 halls.
Why it matters
Taihang shows ByteDance shifting from renting capacity in China to building its own. TrendForce forecasts the campus at 526 MW in 2026, up from 156 MW in 2024, reaching 661 MW in 2028 as the expansion comes online.
Figure 6. Volcano Cloud Taihang campus, Guangling County, Datong, Shanxi (outlined in orange): data halls, with the newest construction at the southern end. Sentinel-2, 8 Oct 2026.
Credit: Contains modified Copernicus Sentinel data (2026).
Alibaba’s 300 MW cluster on Shanghai’s doorstep
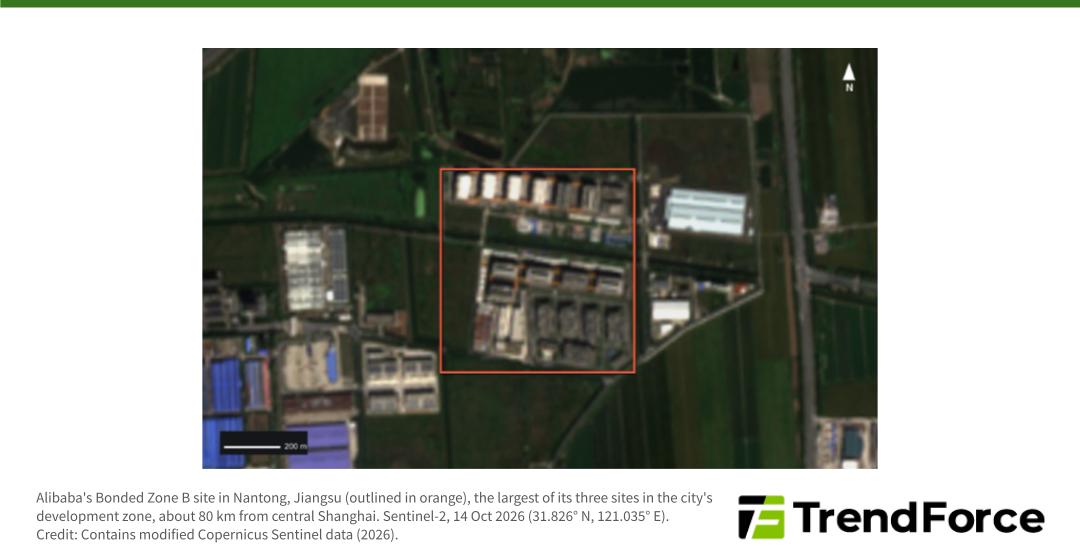
About two-fifths of the Alibaba data center capacity we track in China sits in the power-rich north, around Zhangjiakou and Ulanqab, more than 1,200 km from Shanghai. Nantong is different. About 80 km from central Shanghai across the Yangtze, Alibaba’s cluster there carries more than half of the company’s core business in East China.
Local officials said on 7 October that the cluster has 11 data center buildings and 300 MW of supporting power load, with RMB 33 billion invested. The same development zone is now planning a separate RMB 100 billion compute park with 2.04 GW of power.
Why it matters
Alibaba keeps capacity close to its East China customers as well as in the cheap-power north. The zone’s 300 MW figure matches our bottom-up count. TrendForce forecasts 320 MW across Alibaba’s three Nantong sites in 2026, rising to 416 MW in 2028.
Figure 7. Alibaba’s Bonded Zone B site in Nantong, Jiangsu (outlined in orange), the largest of its three sites in the city’s development zone, about 80 km from central Shanghai. Sentinel-2, 14 Oct 2026.
Credit: Contains modified Copernicus Sentinel data (2026).
About Ground Truth
Ground Truth is a monthly TrendForce Substack column built on our proprietary Data Center Tracker, which covers major hyperscalers in the US and China, and monitors nearly 2,000 facilities worldwide. We cross-reference satellite imagery, permit filings, and utility records with our own supply chain research to deliver a first-hand, verified read on where hyperscalers are actually building AI capacity.
Each Substack issue includes:
- What’s Left to Build: a pipeline chart providing a macro view of each operator’s remaining build-out through 2030
- Monthly Capacity Tracker: a monthly scoreboard highlighting the biggest campus-level changes identified in our tracker
- Major Events: notable developments across the global build-out that readers should know about
Tracking scope
Includes self-built campuses, build-to-suit developments, and fully leased colocation. Excludes shared colocation, cloud regions, and power offtake agreements.
Read the previous issue: TrendForce Data Center Tracker: Where AI Demand Lands.
Satellite imagery in this article incorporates Copernicus Sentinel data. Image processing, construction progress assessments, and industry analysis are independently conducted by TrendForce. No endorsement by the European Union or the European Space Agency is implied.