





 Facebook
 LinkedIn
 LINE
LINE
 Reddit
 WhatsApp
 Kakao
Kakao

About Ground Truth
Ground Truth is a monthly TrendForce Substack column built on our proprietary Data Center Tracker, which covers major hyperscalers in the US and China, and monitors nearly 2,000 facilities worldwide. We cross-reference satellite imagery, permit filings, and utility records with our own supply chain research to deliver a first-hand, verified read on where hyperscalers are actually building AI capacity.
Each Substack issue includes:
- What’s Left to Build: a pipeline chart providing a macro view of each operator’s remaining build-out through 2030
- Monthly Capacity Tracker: a monthly scoreboard highlighting the biggest campus-level changes identified in our tracker
- Major Events: notable developments across the global build-out that readers should know about
Tracking scope
Includes self-built campuses, build-to-suit developments, and fully leased colocation. Excludes shared colocation, cloud regions, and power offtake agreements.
What’s Left to Build
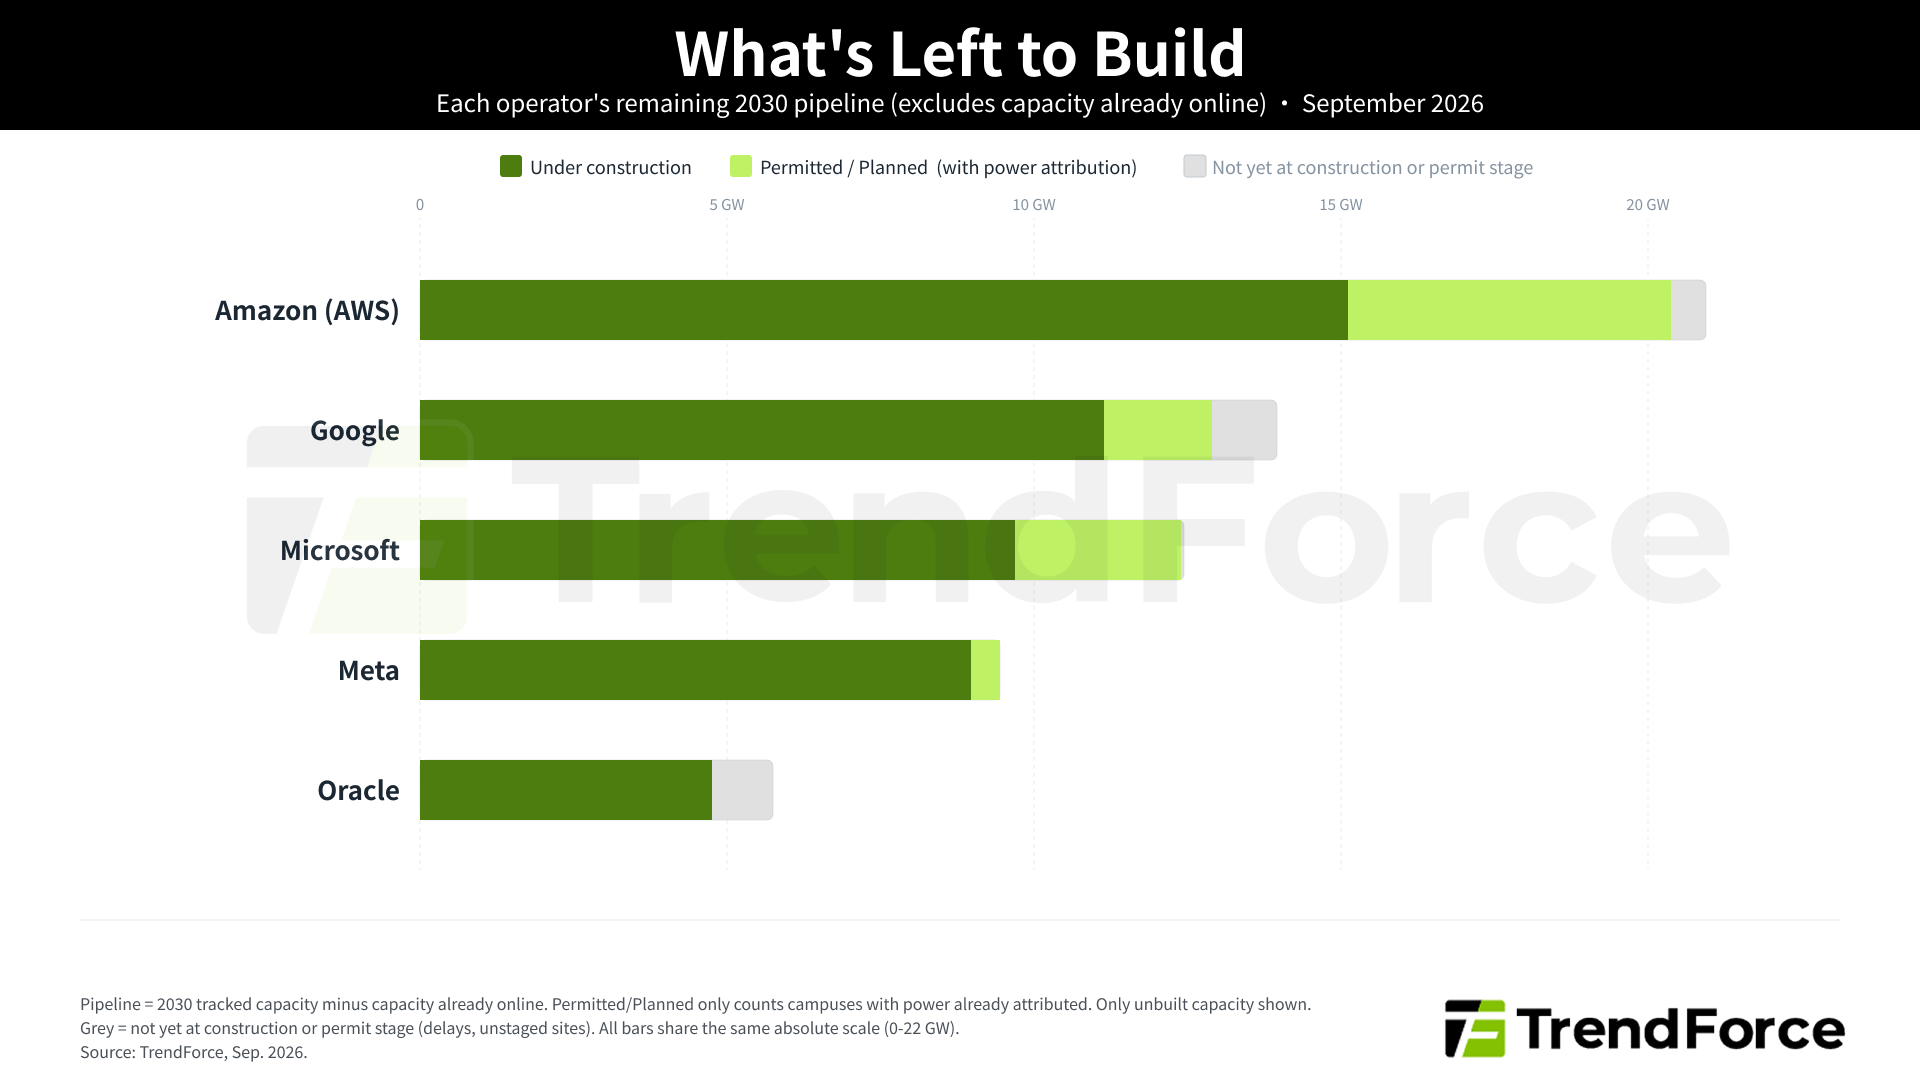
How much data center capacity do the major hyperscalers still have to bring online, and how real are those plans? This chart answers both. Each bar represents an operator’s remaining path to their 2030 pipeline target, with capacity already online stripped out. The green segment is actively under construction, the lighter segment is permitted or planned capacity with an attributed power figure; permitted or planned sites we cannot yet size in MW are excluded, so this segment understates the true total. The grey is pipeline that hasn’t reached either stage yet due to possible delay or other complications. The wider the bar, the bigger the build-out ahead.
Figure 1. Remaining 2030 data center pipeline by US hyperscaler, excluding capacity already online.
Key takeaways from the pipeline
Of the capacity we can size today, most is already under construction. Across the five operators, under-construction work makes up the bulk of the tracked 2030 pipeline, with only a small share still unstaged.
Delay risk looks low for now. Across the five operators, booked delays and unstaged capacity make up only a small share of the 2030 window, and where they appear they are tied to a few named sites rather than spread across the fleet. At the moment, hyperscalers are showing relatively few signs of delay risk or other build-out complications.
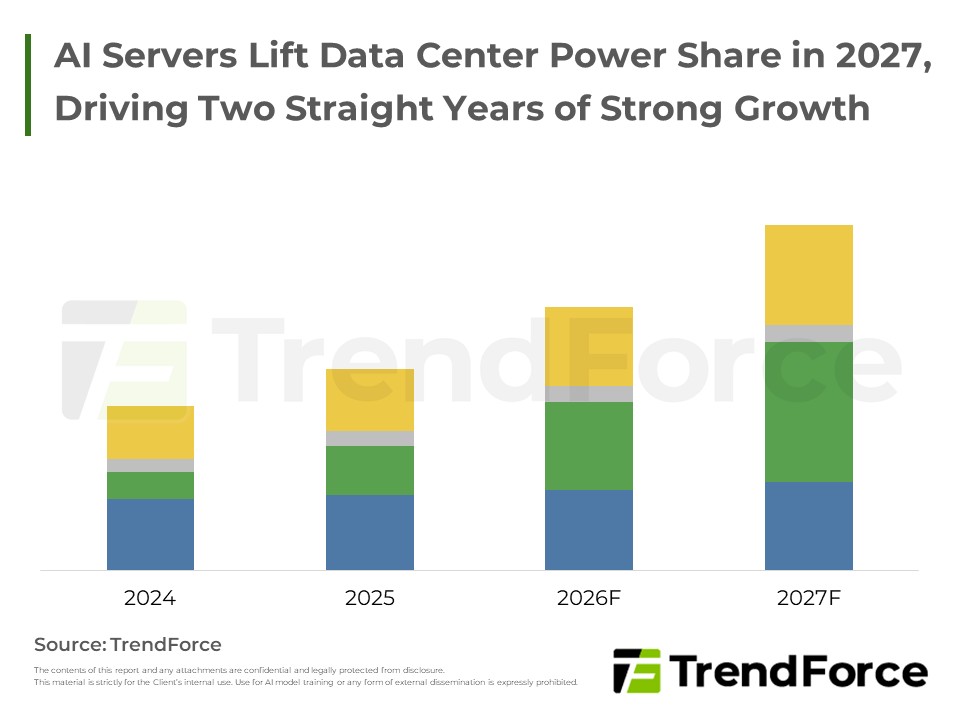
AI Server Boom Outpaces U.S. Grid Buildout
AI servers power surging demand, yet U.S. grid capacity trails shipments as midterm politics raise deferral risk.
See the ShiftMonthly Capacity Tracker
Figure 2. Monthly Capacity Tracker: campus-level capacity changes backed by in-window evidence
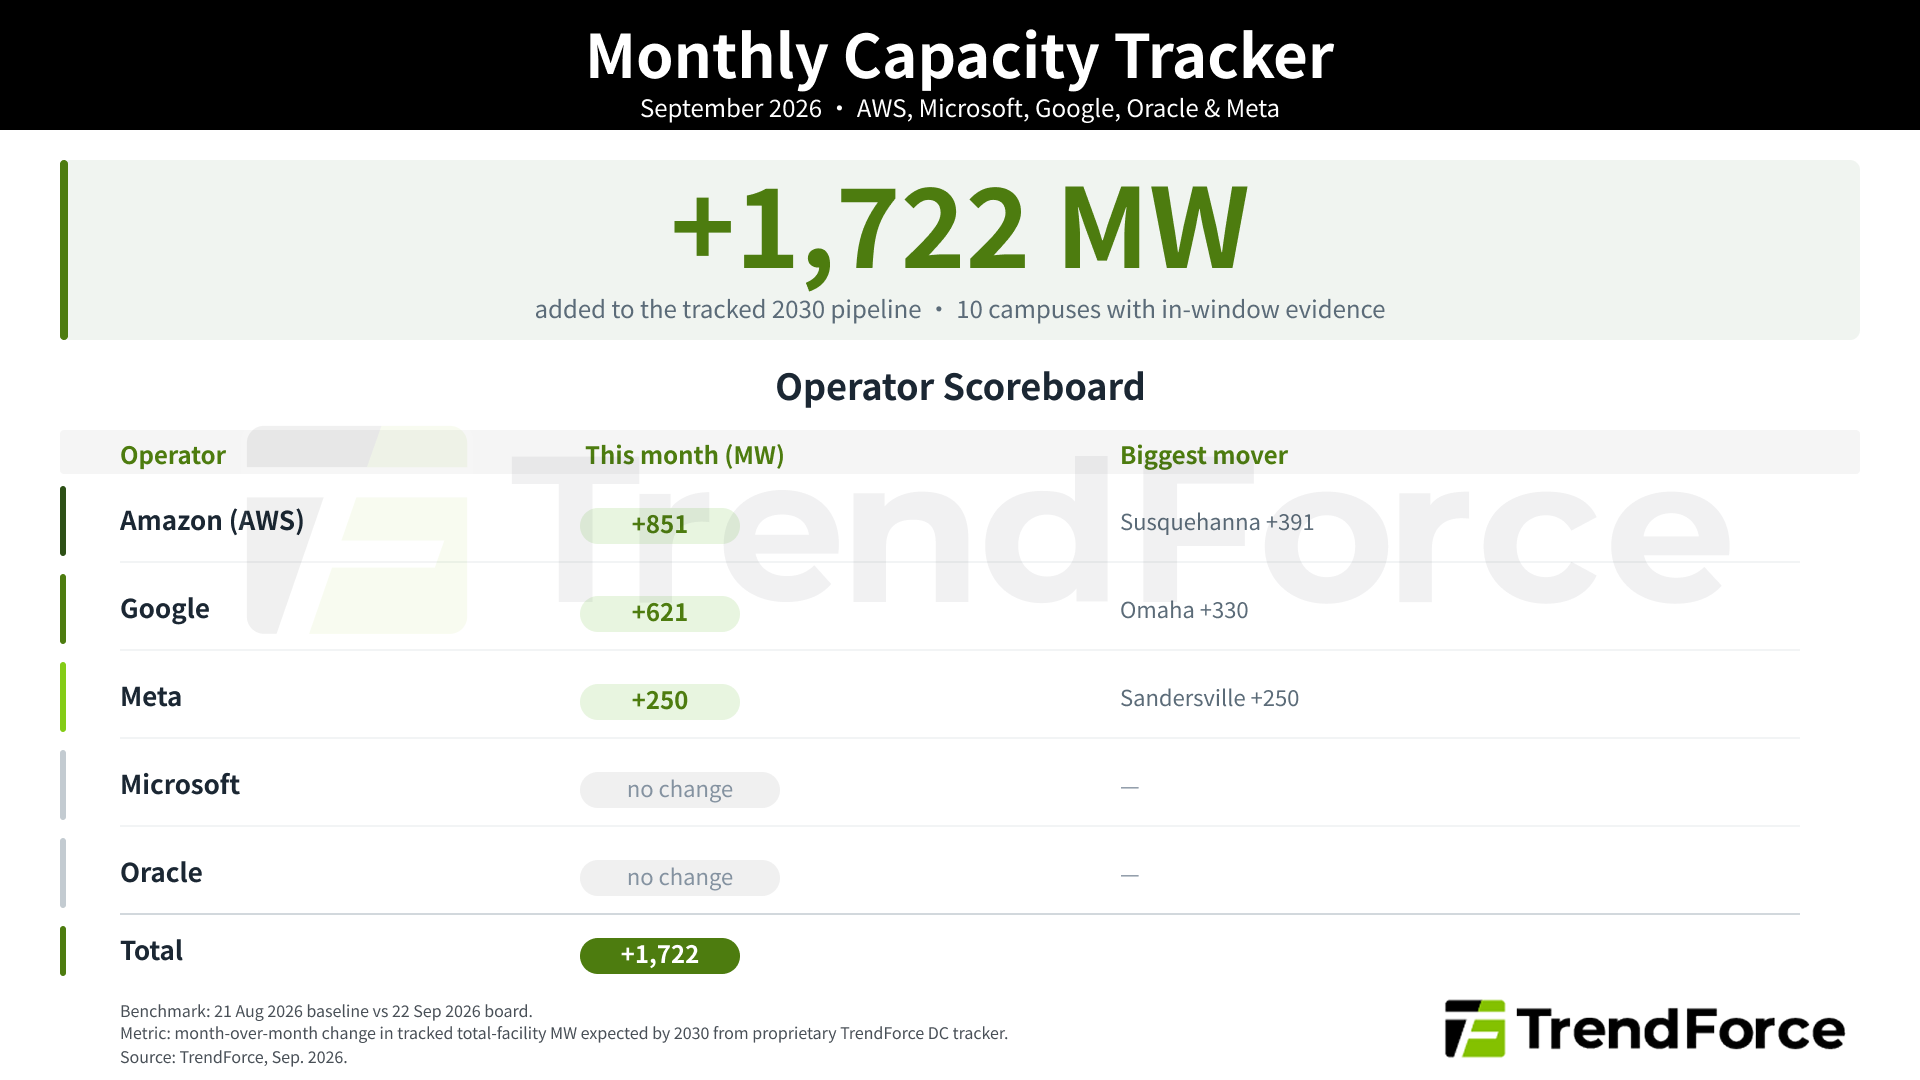
Note: The figures in the monthly capacity tracker are changes to the capacity TrendForce carries in its tracking system, not capacity in operation. Each edition counts only changes whose trigger (a permit action, regulatory filing, construction contract, or operator announcement) is itself dated within the month. Capacity booked on earlier evidence is set aside.
This Month at a Glance
AWS led in total MW this month, driven largely by a single campus: Susquehanna, which accounted for nearly half. Google followed with revisions spanning three countries, led by a new 330 MW air permit in Omaha. Microsoft and Oracle recorded no in-window changes.
For more information on TrendForce’s Data Center Tracker and market data, please contact the Sales Team at SR_MI@trendforce.com.
Major Events
Beyond the charts, here are some major developments we think are worth watching this month. These are the changes across the global build-out that the numbers alone don’t fully capture.
AWS is putting up data centers in months, not years
At its Madison County Mega Site outside Canton, Mississippi, AWS went from groundbreaking in May 2024 to five operating buildings by summer 2025. The next wave is moving even faster: according to a Madison County inspector, steel was up on seven Phase II buildings in late July 2026, and by September 6 satellite imagery shows a row of long, narrow halls already under roof, a visibly different building form from the square Phase I blocks next door.
Why it matters
AWS is openly pushing to industrialize construction. Its reported “Project Houdini” moves data hall fit-out into factories, cutting the time before servers can go in from about 15 weeks to 3. When shells rise in weeks and fit-out shrinks to days, the lag between capex and live capacity collapses, and schedules modeled on 18 to 24 month builds will run behind reality.
Figure 3. AWS Madison County Mega Site, Canton, Mississippi. Phase I (yellow): buildings 1–4 in the two square blocks and building 5 at the south-west end of the row; Phase II (green): the seven long halls. Sentinel-2 true colour, 23 Sep 2026 (nearest clear pass). 32.60°N 90.09°W.
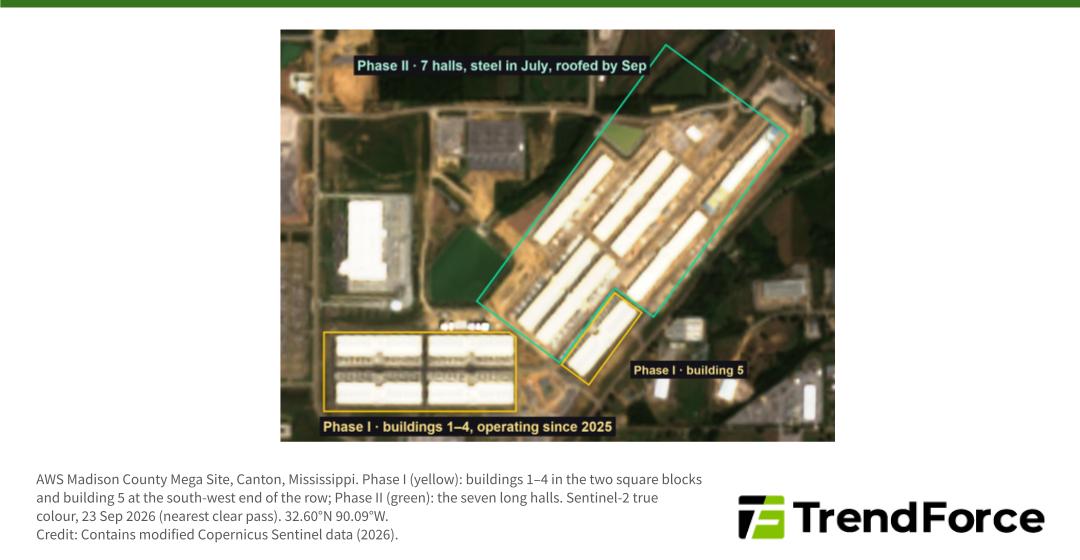
Credit: Contains modified Copernicus Sentinel data (2026).
Google wraps up its Hamina expansion as the Nordics fill up with data centers
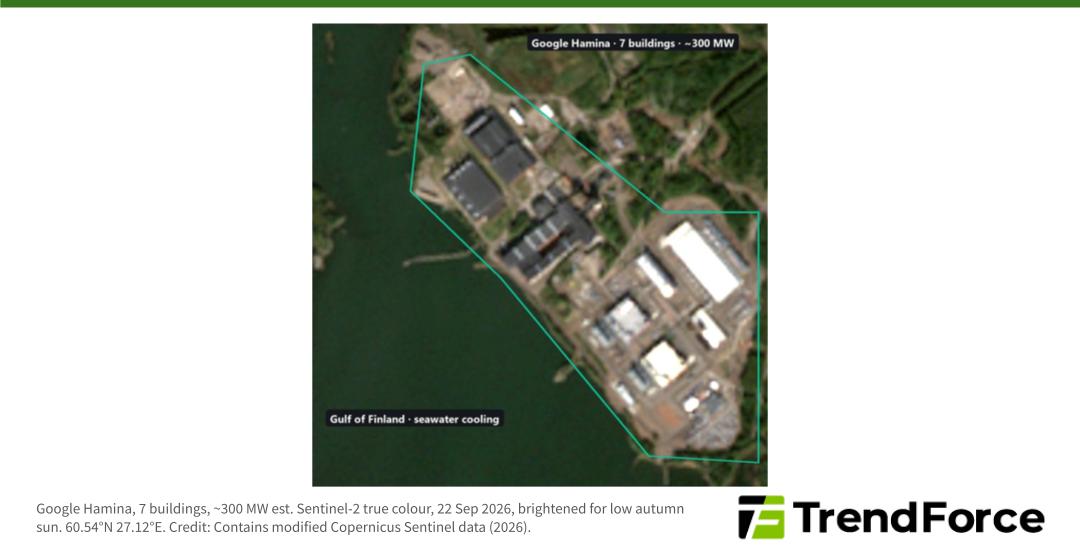
Google’s campus in Hamina, Finland, built inside an old paper mill on the Gulf of Finland, is finishing its seventh building this year. That takes the site to an estimated 300 MW, according to TrendForce’s tracker. In September Google also said it will spend at least €13 billion more in Finland in 2027 and 2028, split between Hamina and three new sites in Kajaani, Muhos and Vaala.
Why it matters
Across the five big US cloud companies, the Nordic capacity we track goes from about 1.4 GW this year to 3.3 GW by 2030. Power in the region comes mostly from hydro, wind and nuclear, and the cold climate keeps cooling costs down. Hamina pulls its cooling water straight from the sea and runs at a PUE of about 1.09. The new €13 billion program isn’t in those numbers yet, because Google hasn’t said how large the new sites will be.
Figure 4. Google Hamina, 7 buildings, ~300 MW est. Sentinel-2 true colour, 22 Sep 2026, brightened for low autumn sun. 60.54°N 27.12°E.
Credit: Contains modified Copernicus Sentinel data (2026).
CSPs Reshape Data Centers: Build-Lease Dual Track
Major US CSPs expand data centers via both build and lease, as construction lags demand, ushering in a dual-track era.
See the ShiftByteDance’s largest landlord raises its target in Shanxi
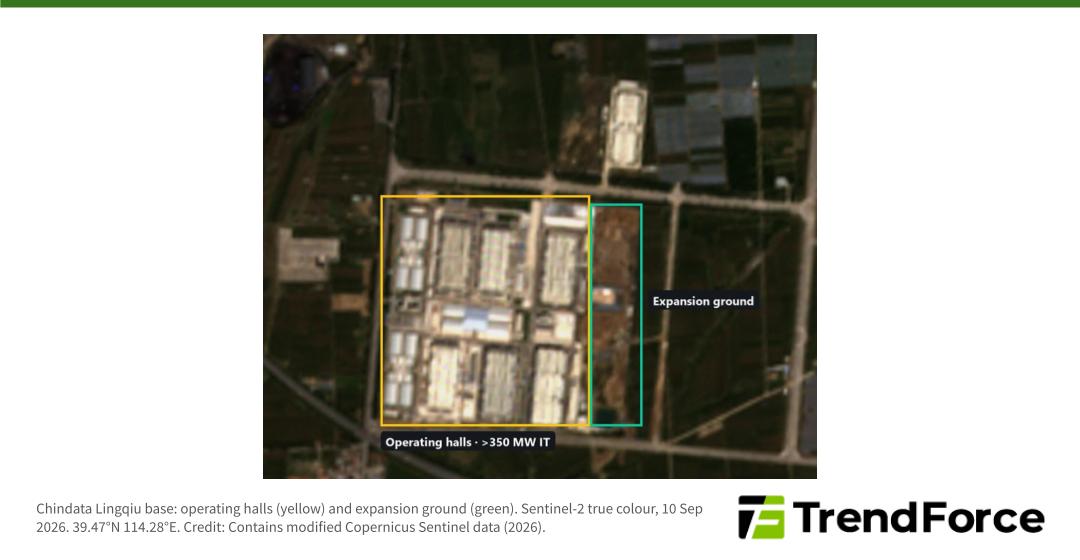
Chindata runs a 13-phase data center campus in Lingqiu county, Datong, with ByteDance as its anchor tenant. In September the company said it now plans more than 600 MW of IT capacity there, up from the “over 500 MW” it had cited before. More than 350 MW is already running, at an annual PUE below 1.18. Eight phases are operating, a ninth is being fitted out, and piling contracts for phase 10 were let this summer.
Why it matters
ByteDance says very little about how much capacity it is adding. Most of what we track for the company sits in leased or built-to-suit buildings, so updates like this one usually come from the landlord. This one raised the planned size of the site by about a fifth, and ByteDance itself said nothing.
Figure 5. Chindata Lingqiu base: operating halls (yellow) and expansion ground (green). Sentinel-2 true colour, 10 Sep 2026. 39.47°N 114.28°E.
Credit: Contains modified Copernicus Sentinel data (2026).
Tencent’s Shaoguan campus clears its first construction milestone, and its next capacity may not be its own
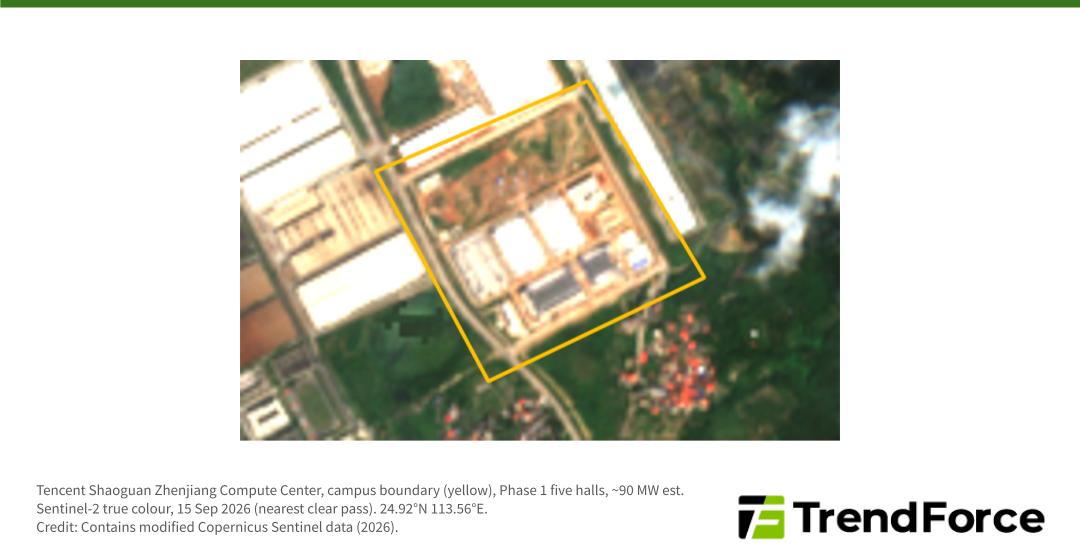
Tencent’s Shaoguan campus in Guangdong passed the as-built check on Building 1 on 11 September, about a year after the structure topped out, while the city’s plan continues to list the project as under construction. Based on our reading of the latest city documents, we now expect the first hall to come online in 2027, with the full 90 MW following in 2028.
Why it matters
Shaoguan is the newest campus Tencent is building itself, and the only one still under construction. That isn’t Tencent stepping back from capacity, it is Tencent leaning on third-party operators instead, taking leased halls that arrive faster than a self-built site like Shaoguan. Our tracker shows additional Tencent capacity through third-party operators, and that capacity only becomes visible when the landlord discloses it, so Tencent’s real pipeline is larger than its own map shows.
Figure 6. Tencent Shaoguan Zhenjiang Compute Center, campus boundary (yellow), Phase 1 five halls, ~90 MW est. Sentinel-2 true colour, 15 Sep 2026 (nearest clear pass). 24.92°N 113.56°E.
Credit: Contains modified Copernicus Sentinel data (2026).